Python
Since most of my projects are written in C++, I’m sharing here two small projects built with Jupyter notebooks. These scripts can be opened with free online services such as Google Colab.
Charts
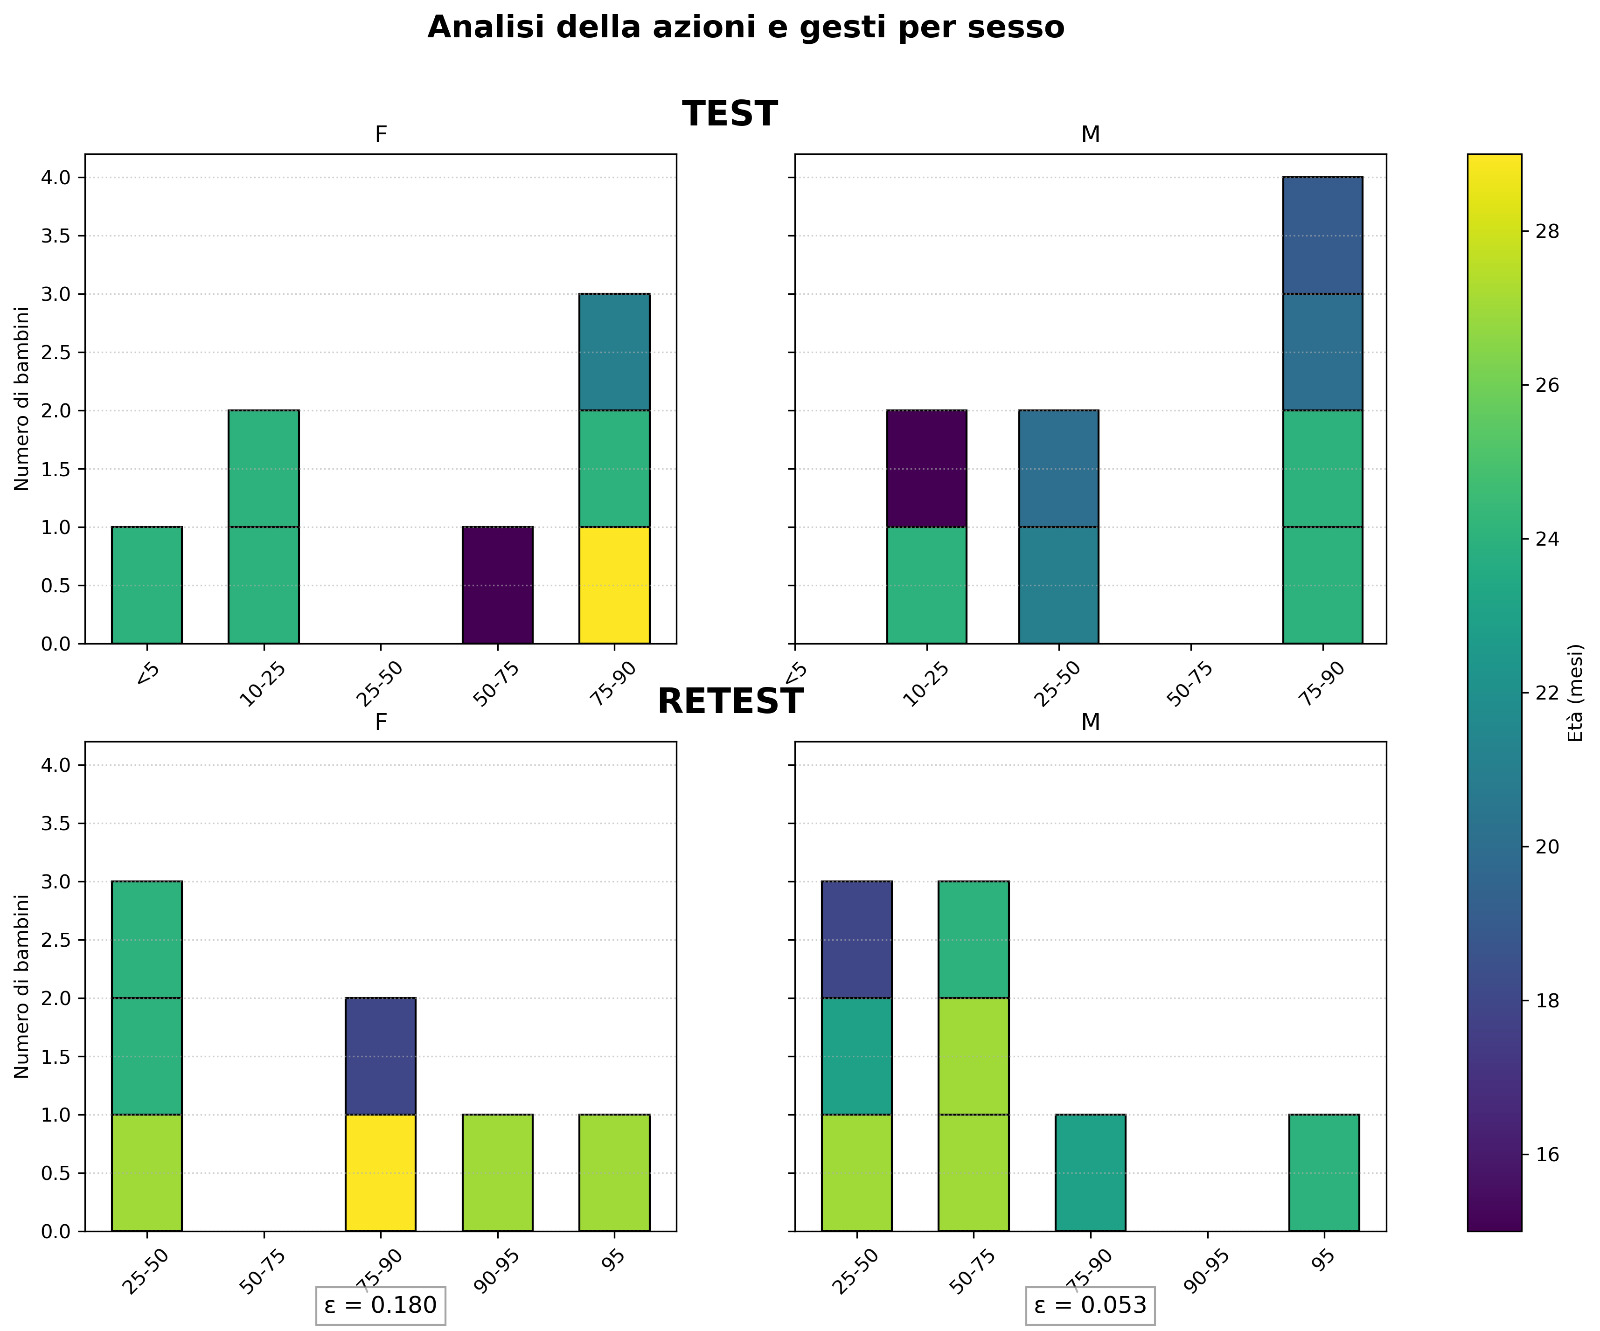
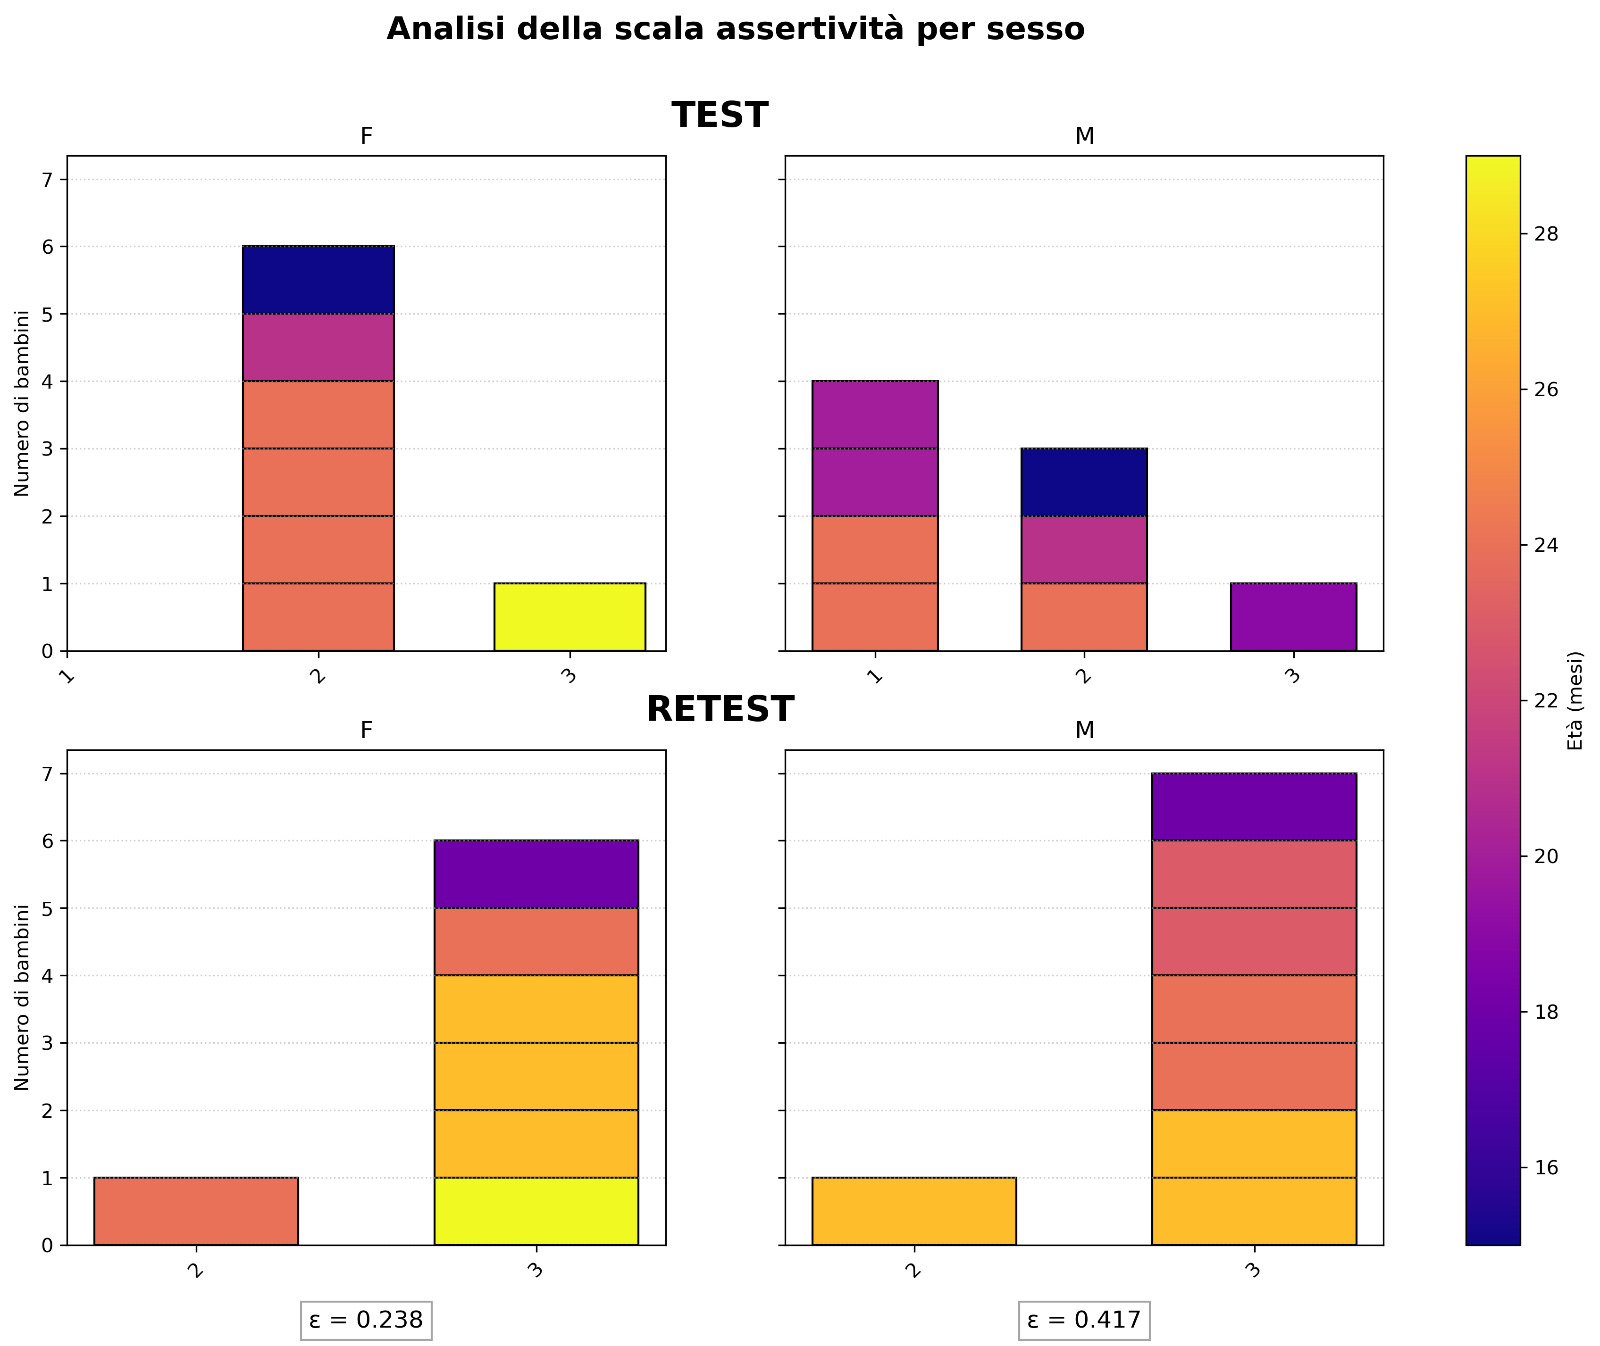
The first script is used to generate the plots shown in Chapter 7 of the thesis for the augmentative communication project. You can visit the project and download the thesis PDF below.
Here are two examples of the resulting plots.
Statistical analysis of the digits of $\pi$, irrational numbers, and Benford’s law
In this project I have explored the statistical behavior of the digits of some irrational numbers and specific numerical sequences, with the goal of experimentally verifying theoretical properties such as digit normality and Benford’s law. The project can be downloaded using the button below.
The entire work was developed in Python, using scientific libraries such as mpmath, numpy, scipy, and matplotlib.
Part I - Digit density in irrational numbers
Goal
Verify experimentally the hypothesis that $\pi$ behaves like a normal number, i.e., that each decimal digit (0-9) appears with frequency 1/10.
Methodology
1. Computing 50,000 digits of $\pi$
I used the mpmath library to generate $\pi$ with arbitrary precision.
It was necessary to set the number of significant digits (mp.dps) correctly and convert the number to a string to analyze each digit.
2. Computing frequencies
For each digit ( $d \in [0,9]$ ) I computed:
\[f_d = \frac{n_d}{N}\]where ( $n_d$ ) is the number of occurrences of the digit and ( $N = 5 \times 10^4$ ).
3. Uncertainty estimates
Assuming a binomial distribution, I estimated the error as:
\[\sigma_{f_d} = \sqrt{\frac{f_d(1-f_d)}{N}}\]4. Linear fit of the data
To formally test the equiprobability hypothesis I fitted the model:
\[f_{lin}(d; \alpha, \beta) = \frac{\alpha}{10} + \beta d\]using scipy.optimize.curve_fit.
The theoretical uniform-distribution hypothesis corresponds to:
\[(\alpha_0, \beta_0) = (1.0, 0.0)\]5. Statistical analysis
From the fit I obtained:
- Best-fit parameters ( $\hat{\alpha}, \hat{\beta}$ )
- Covariance matrix
- Parameter correlation
- Minimum $\chi^2$:
With 10 points and 2 parameters, the degrees of freedom are:
\[n_{dof} = 8\]I then computed the p-value as the survival probability of the $\chi^2$ distribution.
6. Confidence ellipse
Using the covariance matrix returned by the fit, I built the ellipse defined by:
\[\Delta\chi^2 = \chi^2(\alpha,\beta) - \chi^2_{min} = \chi^2_{2,\,0.95}\]The plot shows:
- The best-fit point ( $(\hat{\alpha}, \hat{\beta})$ )
- The theoretical hypothesis ( (1,0) )
- The 68% confidence ellipse
- The 95% confidence ellipse
This allows a visual and quantitative assessment of the compatibility of the equiprobability hypothesis with the data.
Extension to other numbers
The same analysis was repeated for:
- ( e )
- ( $\sqrt{2}$ )
- The golden ratio ( $\varphi$ )
- The concatenation of Fibonacci numbers
- The Lucas and Padovan sequences
In all cases, the digit frequencies are compatible with equiprobability within statistical fluctuations.
It is especially interesting to see how fully deterministic sequences, such as Fibonacci, show statistical properties similar to those expected for normal numbers.
Part II - Benford’s law
The second part of the project concerns the distribution of the first significant digit.
Unlike the internal digits of $\pi$, the leading digit of many real-world quantities is not uniform but follows the logarithmic distribution:
\[f_d = \log_{10}(d+1) - \log_{10}(d)\]with ( $d \in [1,9]$ ).
Analyses performed
1. First digit of Fibonacci numbers
I extracted the first digit of the numbers ( $F_n$ ) and computed the observed frequencies.
I then fitted the parametric model:
\[f(d) = \log_{10}(d + \alpha) - \log_{10}(d + \beta)\]The exact Benford’s law hypothesis corresponds to:
\[(\alpha_0, \beta_0) = (1.0, 0.0)\]In this case as well I:
- Performed the fit
- Computed the covariance matrix
- Built the 68% and 95% confidence ellipse
- Evaluated $\Delta\chi^2$ relative to the theoretical hypothesis
2. Products of random variables
It is known that the product of many independent random variables tends to follow Benford’s law.
I verified this behavior numerically for:
\[Z_n = \prod_{k=0}^{n} X_k\]where ( $X_k$ ) are uniform variables.
As ( n ) increases, the first-digit distribution rapidly converges to the theoretical logarithmic distribution.